Measuring Customer Satisfaction
Many businesses have survey data somewhere, waiting for better analysis. Using a survey containing ratings from 1 to 10, this analytical view correlates ratings of overall satisfaction, firm expertise, and likelihood to recommend for several customer segments. Each circle represents a segment defined by the combination of industry, job function, gender, and product. Size corresponds to the number of customers in that segment.

Create and share on Tableau Public
Join the newsletter and find daily inspiration with the Viz of the Day. Yours could be featured next!
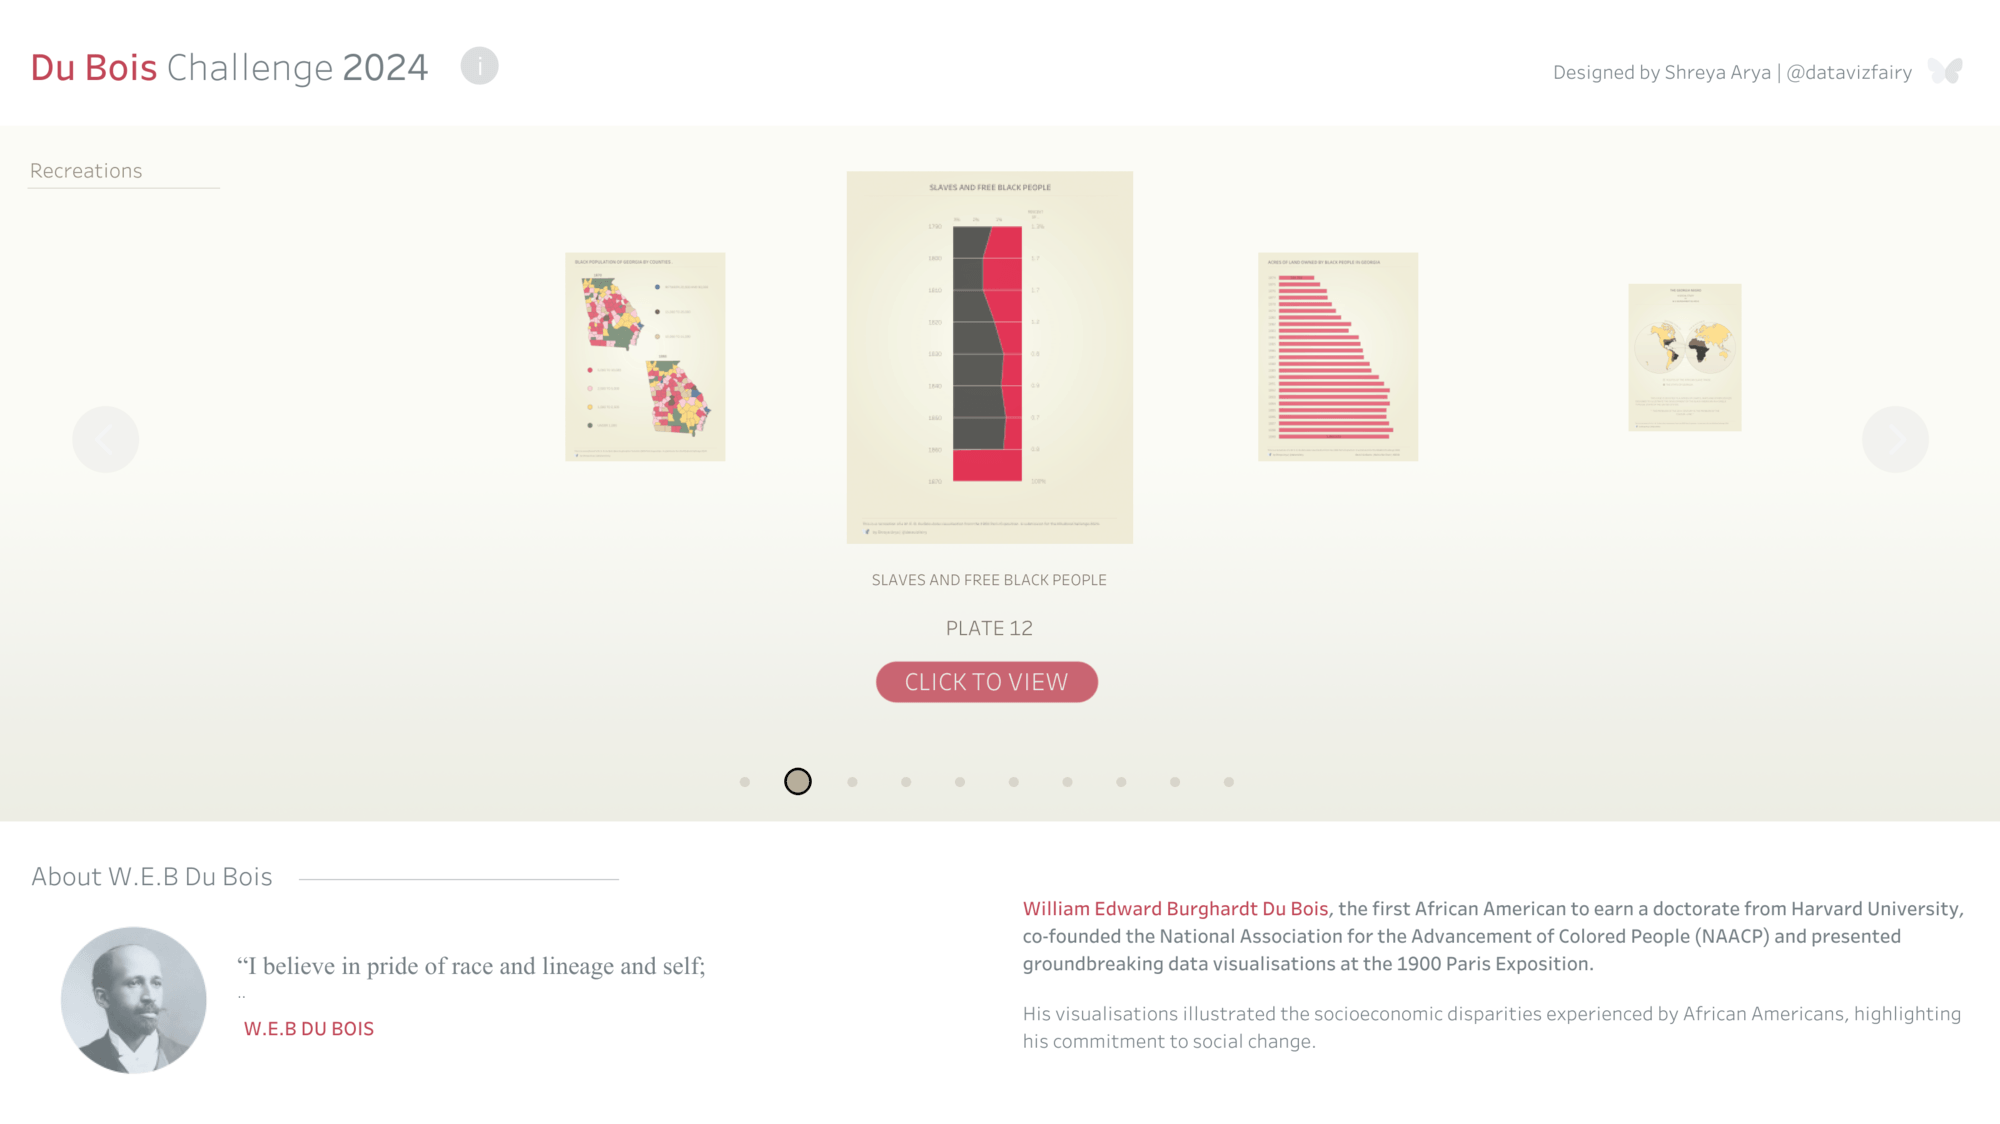
Du Bois Challenge 2024 | Carousel Gallery
Explore this #VizOfTheDay by Shreya Arya, a recreation of the visualizations from the 1900 Paris Exposition. This viz is an entry to the DuBois Challenge 2024—which celebrates the data visualisation legacy of W.E.B. Du Bois.
Interact with the viz